



















What does our dashboard design agency deliver?
We deliver the dashboard as a working part of your product, not only as Figma files. That means the research, the information hierarchy, every state of every screen, the interface copy and the front-end build, all from one team. You get a dashboard your users can read in seconds and your engineers don't have to reinterpret.
Deliverable | What it covers |
|---|---|
User and task map | Who opens the dashboard, how often, and the decision each person needs to make |
Information hierarchy | Which numbers lead, what's one click away and what belongs in a report instead |
Screen designs | Overview, detail, settings and admin screens in Figma, desktop first, with mobile where it matters |
States | Empty, loading, partial data, error, no permission and first-run states for each view |
Components | Tables, filters, charts, cards and forms mapped to your component library or a new one |
Interface copy | Labels, tooltips, empty-state text and error messages |
Front-end build | The screens implemented in your codebase, reviewed through your normal pull requests |
Why is SaaS dashboard design harder than it looks?
SaaS dashboard design is hard because a dashboard has to serve different people making different decisions from the same data. An account owner wants to know if things are on track. An operator wants to find the one row that's broken. A buyer in a trial wants to see value before the trial ends. One layout rarely serves all three.
The common failure is a screen full of charts that answers no question in particular. We start from the questions instead: what does this user need to decide when they open the page, and what number or list would let them decide it. Everything else moves to a detail view or a report. Our guide to SaaS dashboard design best practices covers the principles, and our dashboard design examples show how well-known products apply them.
What goes into data dashboard UI design that teams usually skip?
The parts teams skip are the ones users hit every day: tables, filters and the states around them. A chart gets designed carefully once, while the data table that people sort and filter fifty times a day is left to defaults.
- Data tables: column priority, sorting, sticky headers, row actions, bulk selection and what happens on a narrow screen. See our guide to data table design.
- Filters and saved views: how filters combine, how they show they're active and how a user gets back to their usual view.
- Empty and first-run states: what a new account sees before there's data, written to get the user to their first useful action. Our empty state design guide covers this.
- Loading and partial data: skeletons, stale-data warnings and what to show while a slow query runs.
- Errors and permissions: clear messages that say what went wrong and what the user can do about it.
- Numbers and units: consistent formatting, time zones, comparison periods and what a change is compared against.
How is admin panel design different from a customer dashboard?
Admin panel design is about speed and safety for your own team, while a customer dashboard is about clarity and value for people who pay you. They share components but not priorities, so we design them differently.
Customer-facing dashboard | Admin panel or internal tool | |
|---|---|---|
Main user | Customers, often occasional users | Your support, ops or sales team, all day |
Main goal | Show value and the next action | Find, edit and fix records fast |
Density | Lower, with guidance and explanation | Higher, with keyboard shortcuts and bulk actions |
Risky actions | Rare, heavily confirmed | Frequent, needing undo, audit logs and permission checks |
Copy | Plain language and onboarding hints | Precise labels your team already uses |
Our article on admin panel design goes deeper on internal tools, including roles, audit trails and destructive actions.
How do we design and build your dashboard?
Free intro call
Thirty minutes on your product, your users, the screens that cause the most trouble and your stack.
Audit and user map
We review the current product, analytics and support tickets, and join customer calls to see how people use it.
Hierarchy and wireframes
We agree what each screen is for and sketch the structure with real data before any visual design.
Visual design and states
We design the screens and every state in Figma, built on your component library or a new one.
Build in your codebase
We implement the screens in your front end and open pull requests that follow your conventions.
Review with users
We check the shipped screens with real users and fold what we learn into the next item on the list.
Because the same team designs and builds, we decide on interaction details in code rather than in long handoff documents. If your product has no component library yet, our design system service covers that work, and many teams start from an existing open-source kit instead of a custom system.
How do accessibility and performance shape a dashboard?
They set hard limits on color, contrast and responsiveness, so we design to them from the start. The W3C's WCAG 2.2 asks for a contrast ratio of at least 4.5:1 for normal text and 3:1 for meaningful non-text elements such as chart lines and input borders. That rules out the pale grays and color-only status indicators many dashboards rely on.
Performance matters just as much on data-heavy screens. Google's Core Web Vitals guidance on web.dev treats an Interaction to Next Paint of 200 milliseconds or less as good, and large tables and charts are where that slips. We plan pagination, virtualized lists and lazy-loaded charts with your engineers, so the dashboard stays responsive with real account sizes.
How much does dashboard design cost?
Dashboard design pricing varies widely in the market, mostly by the number of screens, the complexity of the data and whether development is included. Typical design retainers we see quoted run about $2,000 to $12,000 a month depending on scope and seniority, and hiring sources put a fully loaded in-house designer at $90,000 to $150,000 or more a year, before any development.
- per month, flat, dashboard design and build
- $6,000
- brand and design sprint with 10 product explorations
- $3,000
- trial week on one real screen
- $1,000
Most dashboard work runs on our $6,000-a-month retainer, because dashboards keep changing as the product grows. If you want design direction before committing to a build, our $3,000 brand and design sprint includes 10 website or product explorations in Figma. Our dashboard design cost guide explains what drives quotes, and our product design service covers the wider product work.
Who is this dashboard design service for?
It's for SaaS teams with a live product whose dashboard has grown by accretion: new features added as new widgets, a table nobody can filter, and support tickets asking where things are. It also suits AI and data products where users need to trust what a number means before acting on it.
It's not the right fit if you need a one-off set of screens with no build, or a large enterprise program with a dedicated research team and months of discovery. For a pre-launch product, start with our MVP design service, which focuses on the first version rather than reworking an existing one.
Which product interfaces have we designed?
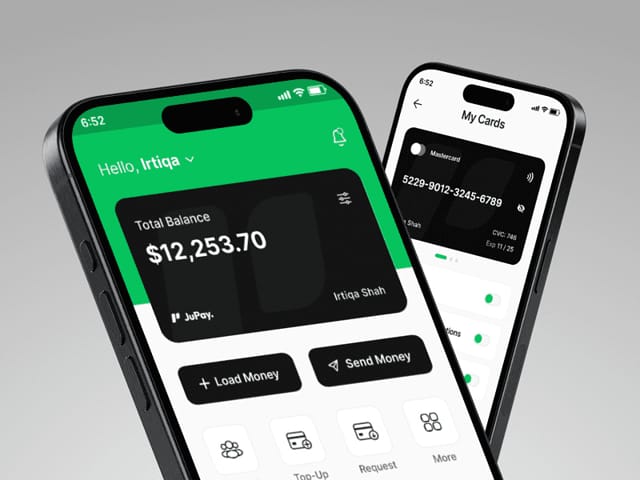
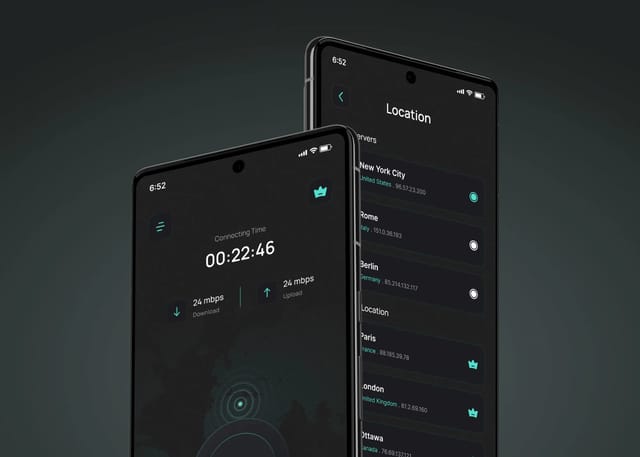
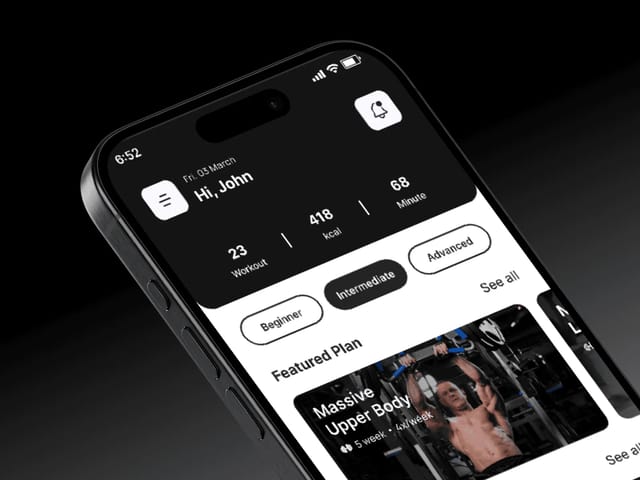
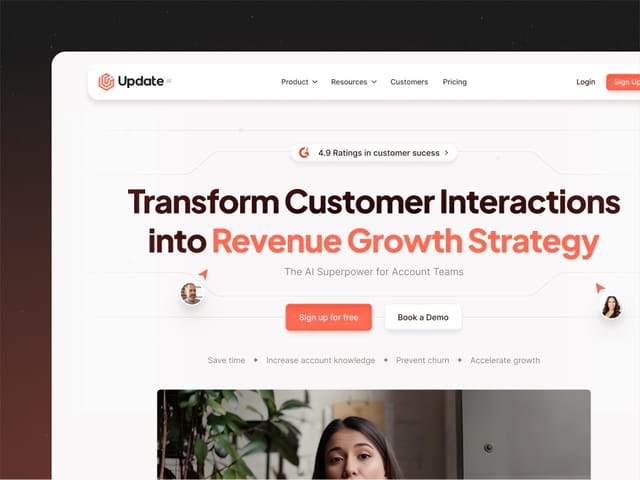
We designed JuPay, a cross-border mobile finance app covering money transfers, card management and cross-border payments, where clarity around money movement was the whole job. We designed the Wirefox VPN mobile app and its brand identity, and PowerPulse, a workout app built around tailored routines. On the marketing side, we designed and built Update.ai's website, an AI platform that turns customer conversations into recaps, where the job was turning a complex product into a clear story. On the free intro call we'll show you the work closest to your product and say plainly where it differs.